There is a significant lack of suitable affordable housing in the Fingal area as witnessed by the vast amount of young families who are renting in the area and being cripples with huge unfailr rent...
Appendix 1: Fingal Housing Strategy
Closed19 Feb, 2016, 10:00 - 29 Apr, 2016, 17:30
Introduction
Under Section 94 of the Planning and Development Act 2000 (as amended) Fingal County Council is required to prepare a Housing Strategy for period 2017-2023. To ensure that the Housing Strategy is kept up to date, Planning Authorities must review and amend it, if required within 2 years of its preparation. This Strategy should also be reviewed where there is a change in housing requirements or in the housing market that could fundamentally affect the existing strategy. The key objectives of the Strategy are as follows:
- To ensure Fingal County Council provides for the development of sufficient housing to meet its obligations as set out in the Regional Planning Guidelines
- To identify the existing and likely future need for housing in the area of the Development Plan
- To ensure that sufficient zoned lands are provided to meet the needs of the different categories of households
- There have been considerable changes since 2008 in the Irish economy, in particular, affecting the construction industry and property market which have led to significant changes to Government housing policy and plans for the future supply of housing.
- These changes are reflected in;
- Housing Policy Statement issued by the Department of Environment and Local Government in 2013.
- Housing Agency reviewed Part V of the Planning and Development Act, 2000 (as amended) was completed in July 2015.
- The Urban Regeneration and Housing Act 2015.
Legislation
Part V of the Planning and Development Act 2000 (as amended), hereafter referred to as ‘The Act’, requires that all Planning Authorities prepare Housing Strategies and incorporate them into their Development Plans. Section 10(1A) of The Act requires that Development Plans include a Core Strategy which shows that the Plan is consistent with both the National Spatial Strategy and Regional Planning Guidelines. Planning Authorities are required to demonstrate that the Housing Strategy is aligned with the population projections contained in the Core Strategy and the Regional Planning Guidelines.
The Housing Strategy must include an analysis of demand and supply for the different sectors of the housing market, forecast future requirements and propose strategies to balance demand and supply in a sustainable manner.
In accordance with The Act there is a social housing requirement of 10% applicable to planning permissions for housing on all lands zoned solely for residential use, or for a mixture of residential and other uses, save in specified circumstances where an increased element may be acceptable.
The Act specifies, in particular, that the Housing Strategy shall:
- Ensure that adequate zoned and serviced lands for residential purposes are available in appropriate locations to meet the requirements of the Housing Strategy and the existing and future housing demand – including social and affordable housing (This requirement has been superseded by the Core Strategy).
- Ensure that housing is available to people of different income levels and determine the distribution of this housing.
- Ensure that a mixture of house types and sizes is developed to reasonably match the requirements of the different categories of households, including the special requirements of elderly persons and persons with disabilities.
- Counteract undue segregation in housing between people of different social backgrounds.
The Housing (Miscellaneous Provisions) Act 2009
The Housing (Miscellaneous Provisions) Act 2009 requires the preparation of Housing Services Plans and contains provisions on the assessment of social housing needs. It also revises the Housing Authority’s management and control powers and introduces antisocial behaviour strategies. It is the policy of Fingal County Council to increase the stock of social housing to meet the long term housing needs of those households on the local authority housing list.
The Urban Regeneration and Housing Act 2015
The Urban Regeneration and Housing Act 2015 was introduced in July 2015 and its purpose is to address housing supply related issues and to facilitate an increase in activity in the housing construction sector. The Act also supports the delivery of the Government's Construction 2020 – A Strategy for a Renewed Construction Sector and the Social Housing Strategy 2020. In addition specific amendments relating to the operation of Part V aim to:
- Increase the economic viability of developments
- Maximise the opportunity for the delivery of social housing units
- Address weaknesses in aspects of the existing legislation identified in a number of court judgements
- Secure the principle of integrated mixed tenure developments
In accordance with The Act there is a social housing requirement of 10% which will be applied to planning permissions for housing on all lands zoned solely for residential use, or for a mixture of residential and other uses, save in specified circumstances where an increased element may be acceptable.
Part V delivery options (Post Act 2015)
- The transfer of ownership of lands, subject to the planning permission application to a local authority for the provision of social housing remains the default option. The land option must be acceptable to the local authority
- The transfer of ownership to the local authority, or persons nominated, of completed social housing units on the land, subject to planning permission
- The transfer of ownership to the local authority, or person nominated, of completed social housing units on other land, not subject to the planning permission. There is no longer a requirement for the developer to build housing units on other land to fulfil his/her Part V obligations. The developer might have a stock of suitable houses or he/she can simply acquire housing units for such purposes. This allows social housing units to be delivered in a more timely fashion in another location, in the event that the development that is the subject of the planning permission does not meet the social housing or mixed tenure needs of the local authority:
- The Part V obligation can now be fulfilled by developers through long term leasing of properties: and
- A combination of the Part V options above is also allowed
Part V options removed under The Act of 2015:
- The option of transferring ownership to the Local Authority, or persons nominated, of fully or partially serviced sites on land, subject to the planning permission application:
- The option of transferring ownership to the local authority of land within its functional area: other than the land subject to the planning permission application:
- The option of transferring ownership to the local authority, or persons nominated, of fully or partially serviced sites on land, other than the land subject to the planning permission application: and
- The option of providing a cash payment in lieu of social housing.
National and Regional Policy
The Government outlined its commitment to ensure that housing provision was sustainable and of high quality in its guidance documents ‘Delivering Homes, Sustaining Communities (2007), ‘Quality Housing for Sustainable Communities’ (2007).
The Department of Environment, Community and Local Government (DoECLG)’s ‘National Housing Strategy for People with a Disability’ (2011) outlines the Government strategy to address the housing needs of people with disabilities over the period 2011 to 2016. The Government’s Housing Policy Statement, also published in 2011, supports and further supplements the ‘National Housing Strategy for People with a Disability’ as part of a framework of initiatives to provide for the housing needs of vulnerable and disadvantaged households. It outlines a vision for the future of the housing sector in Ireland ‘based on choice, fairness, equity across tenures and on delivering quality outcomes for the resources invested’. The Housing Policy Statement stated that the Government was standing down all existing affordable housing programmes to reflect current affordability conditions.
The DoECLG Homeless Strategy National Implementation Plan (2008) states that the Strategy will be carried out primarily through the Local Homeless Action Plan process prepared under the Housing (Miscellaneous Provisions) Act 2009.
National Spatial Strategy (NSS)
The National Spatial Strategy 2002 – 2022 outlines the Government’s commitment to implementing long-term planning frameworks - taking account of the experience since 2002 and the new environmental, budgetary and economic challenges. There is a continuing emphasis on encouraging more sustainable patterns of urban and rural development. It is noted that the DoECLG have indicated that a comprehensive review and update of the NSS is underway in response to the country’s significantly changed economic landscape.
Regional Planning Guidelines for the Greater Dublin Area 2010 – 2022
The Regional Planning Guidelines (RPG) for the Greater Dublin Area (GDA) 2010 - 2022 aim to direct and influence future growth of the Greater Dublin Area (GDA) over the medium-to -long term, and to give effect to the overarching strategic planning framework set out in the NSS.
In relation to rural housing, it advises that local authority policies need to ‘take account of the differing types of rural housing demands in varying rural contexts and be tailored accordingly’.
Social Housing Strategy 2020
The Social Housing Strategy was published on the 26th November 2014 and is based on a Three Pillars model that will strive to ensure every household can secure, quality housing suited to their needs at an affordable price in a sustainable community. The Three Pillars Strategy is as follows:
- Pillar 1: Provision of New Social Housing Supply
- Pillar 2: Providing Housing Supports Through the Private Rental Sector
- Pillar 3: Reform Creating More Flexible and Responsive Social Housing Supports
The strategy aims to:
- Provide 35,000 new social housing units, over the period 2017-2023 to meet the additional social housing supply requirements.
- Support up to 75,000 households through an enhanced private rental sector;
- Reform social housing supports to create a more flexible and responsive system.
The strategy plans to deliver over two phases:
- Phase 1 sets a target of 18,000 additional housing units and 32,000 Housing Assistance Payment (HAP)/Rental Accommodation Scheme (RAS) units by end 2017.
- Phase 2 sets a target of 17,000 additional housing units and 43,000 HAP/RAS units by end 2020.
Implications for the Fingal County Development Plan
Section 94 of the Planning and Development Act, 2000 outlines the criteria that the Planning Authority should have regard to when estimating the amount of housing required in the Plan area. The criteria include house prices, interest rates and the relationship between house prices, interest rates and income.
This Strategy endeavours to address the obligations set out in Section 94 and in accordance with the amended Part V options as set out in Urban Regeneration and Housing Act 2015 but all the time recognising and having regard to the rapidly changing and evolving housing landscape both nationally and locally.
The Council will employ a range of mechanisms to meet identified council needs i.e, a social housing building programme, acquisition, leasing, Housing Assistance Payments (HAP) scheme, Rental Accommodation Schemes (RAS) and the utilisation of existing housing stock.
Analysis of Housing Demand and Supply
Population
Fingal is the third largest administrative county in Ireland. Nearly 6% of the state's population now lives in the County. The population of Fingal in the 2011 Census was 273,991 persons, 21.5% of the total population of Dublin. Fingal’s share of the Dublin population has been rising steadily since 1986 when it was just 14% rising to 22% in the latest 2011 census.
Fingal Population 2002 -2011
|
2002 |
2006 |
2011 |
Increase |
Increase % |
|
|---|---|---|---|---|---|
|
Fingal |
196,413 |
239,992 |
273,991 |
33,999 |
12.4% |
Source: CSO Census 2011
Fingal household breakdown
|
Census 2011 |
Fingal Private Households |
Persons in Provate Households |
Average Number of Persons per Household |
|---|---|---|---|
|
93,146 |
271,958 |
2.9 |
Source: CSO Census 2011
The 2011 Census indicated a continuing high growth rate in Fingal in spite of the slowdown in the economy and housebuilding in particular. This growth was due primarily to the high birth rate in the county and to the relatively low death rate. Immigration was also a factor although it is likely that much of this took place between 2006 and 2008.
The Regional Planning Guidelines projected population growth for the Fingal area over the period 2011-2022 as:
|
2011 |
2016 |
2022 |
|
|---|---|---|---|
|
Fingal |
273,991 |
287,547 |
309,285 |
Settlement Strategy
The framework for Fingal’s Settlement Strategy is set out in the Regional Planning Guidelines. The Strategy is based on a differentiation of towns within the Metropolitan Area of the county and those within the Hinterland Area (these areas being defined at regional level). The thrust of the Settlement Strategy is to consolidate urban areas around the Dublin Gateway and integrate investment in infrastructure, in particular public transport, with land use planning.
Within the Metropolitan Area, Swords and Blanchardstown are targeted for the greatest growth in population, housing, retail and economic activity. These towns, described as metropolitan consolidation towns are envisaged as strong active urban places with strong transport links. In 2011, Swords had a population of 42,738 (Census 2011, Towns), representing growth of 13.5% since 2006. The wider Blanchardstown area had a population of approximately 100,000, based on the relevant Electoral Divisions. Donabate, on the edge of the Metropolitan Area, is identifiedas a Moderate Sustainable Growth Town which will act as a district growth centre with high quality linkages and increased densities at nodes on public transport corridors. It is recognised that Donabate will have a strong role as a commuter location and therefore growth needs to be related to the capacity of public transport connections and the capacity of social infrastructure. There are a number of other towns within the Metropolitan Area such as Portmarnock, Sutton, Malahide and Baldoyle. These towns are identified as consolidation areas within the Gateway in the current Development Plan. Policy for these towns is largely based on urban consolidation with growth related primarily to higher densities along public transport corridors.
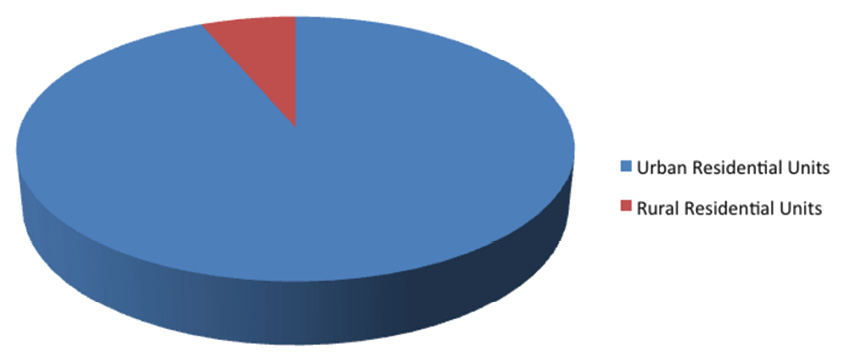
Fingal County Council House Count Survey 2014
A house count survey carried out in 2014 showed 96,049 Urban Residential Units - 6,598 Rural Residential Units
FCC Household Count 2014
Age Dependency Ratios 2011
|
0-14 years N |
15-64 years N |
Over 65 years N |
Young age ratio % |
Old age ratio % |
Total dependancy ratio % |
|
|---|---|---|---|---|---|---|
|
Dublin City |
80,029 |
381,093 |
66,490 |
21.0 |
17.4 |
38.4 |
|
Dún Laoghaire - Rathdown |
37,535 |
138,854 |
29,872 |
27.0 |
21.5 |
48.5 |
|
Fingal |
66,407 |
187,723 |
19,861 |
35.4 |
10.6 |
46.0 |
|
South Dublin |
61,281 |
180,871 |
23,053 |
33.9 |
12.7 |
46.6 |
Source: CSO
The age profile of the Fingal area as compared to the state average is as follows:
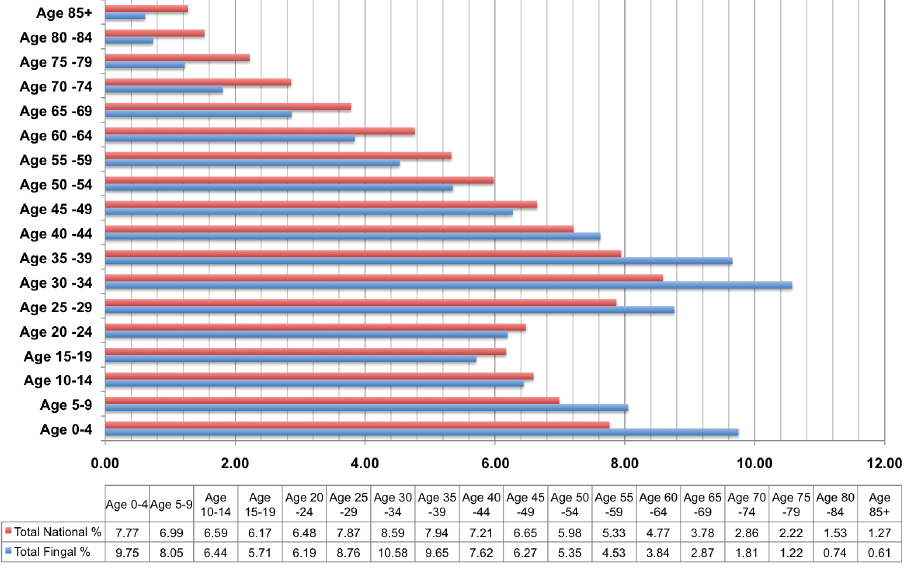 Source: Fingal Local Community Development Committee: Demographic and Socio-Economic Profile: Statistical Baseline
It is important that new housing meets the needs of all of the population and that there is a sufficient choice of house type/size and housing tenure. A recent study carried out by the Housing Agency has indicated that 57% of all households in the Dublin Region will be for one and two person households, while three person households will account for a further 18% . It is likely that a high proportion of the 18% may be in Fingal but there should be choice so that people can move freely within the area in which they live, as their needs and circumstances change.
Housing Tenure
|
Housing Tenure |
% in Fingal |
|---|---|
|
Owner occupied without loan or mortgage |
23 |
|
Owner occupied with loan or mortgage |
47 |
|
Rented from private landlord |
22 |
|
Rented from a Local Authority |
5 |
|
Rented from a Voluntary Body |
0.8 |
|
Occupied free of rent |
0.8 |
|
Not stated |
1 |
Source: Census 2011
Fingal County Housing Assessment 2017-2023
The estimate of the required projected supply of social housing provision for Fingal County for 2017 to 2023 is based on the application of the methodology developed by the Department of the Environment and Local Government model based on the application the “Part V of the Planning and Development Act, 2000, Housing Supply: A Model Housing Strategy and Step-by-Step Guide” (December, 2000).
The following sets out the principal steps involved in the development and application of this model and the associated calculation, determination and summary output tables.
Key Assumptions Used:
Fertility
Two Total Fertility Rate (TFR) assumptions are put forward by the CSO in the regional projections:
F1: TFR to remain at its 2010 level of 2.1 for the lifetime of the projections (CSO 2016 - 2031).
F2: TFR to decrease from its 2010 level of 2.1 to 1.8 by 2026 and remain constant thereafter.
Fingal County is currently above 2.1 TFR (2.16 TFR in 2011). It was therefore decided to generate the scenarios in line with the F1 assumption for fertility, as it is not held to be likely that Fingal’s TFR will decline to 1.8 within the period. Therefore, a gradual reduction per annum to 2025 was applied.
Mortality
The national mortality assumptions were adopted for each of the projected scenarios. Under these assumptions, the estimated rate of improvement for each sex at each age was factored into the modelling process. Graduated tables of age-specific rates of mortality and survivorship post 2031 were maintained as constant for each subsequent year of the period.
Male Rate of decrease in mortality: 3.5% per annum from the 2010 levels
Female Rate of decrease in mortality: 2.5% per annum from the 2010 levels
As consistent with gains in life expectancy at birth from:
Males: 78.3 years in 2011 to 83.0 years by 2031
Females: 82.9 years in 2011 to 86.6 years by 2031
Migration
The published CSO inter-regional patterns for migration, between the period 1996 to 2011, reveal a fairly stable picture in terms of the magnitude of movement between regions, with the Dublin Region and Mid-East Region showing a net inward migration and the other regions showing a net outward flow.
The general consensus (of the CSO expert group) is such that both Dublin and the Mid-East are likely to continue to grow in the medium to long term. This forms the basis of utilising the M2 migration assumption. However, there are further inter-regional assumptions available leading to the branching of the M2 into a High, Medium and Low spread; called ‘Modified’, ‘Traditional’ and ‘Recent’ respectively. Recall:
- ‘Modified’ sees a pattern of increased movements into Dublin applied at the expense of all other regions with the exception of the Mid-East.
- ‘Traditional’ sees a gradual reversal to the stable 1996 pattern of inter-regional flows by 2021 and is kept constant thereafter.
- ‘Recent’ sees the pattern of inter-regional flows observed in the year to April 2011 applied up to 2031.
While the Recent inter-regional assumption yields higher numbers of net inward migrants to Fingal than the Traditional assumption, when taken in conjunction with the natural levels of growth, the Traditional assumptions surpasses the Recent, therefore, Traditional forms the [Medium] scenario.
Step 1: Determination of Annual Population Projections - Fingal County 2017-2023
Determination Method – determination of annual population based on an M2F1 Traditional population projection scenario. This M2F1 Traditional scenario reflects a “medium” growth projection for the county based on the following:
- Moderate natural growth with stable migration and standard mortality – M2.
- Total fertility rate decrease to 2.1 by 2026 and remain constant thereafter – F1.
- ‘Traditional’ sees a gradual reversal to the stable 1996 pattern of inter-regional flows by 2021 and is kept constant thereafter.
Key Information Inputs – data input from Central Statistics Office (CSO), Fingal County Council.
Table 1: Annual Population Projections
|
Year |
Fingal County Population Total |
Percentage Increase |
Annual Population Increase During Year |
Total Population Increase 2017-2023 |
Total Population Increase 2011-2023 |
|---|---|---|---|---|---|
|
2017 |
290,462 |
1.31% |
4,121 |
|
|
|
2018 |
294,582 |
1.42% |
4,178 |
|
|
|
2019 |
298,761 |
1.42% |
4,257 |
|
|
|
2020 |
303,018 |
1.42% |
4,377 |
|
|
|
2021 |
307,395 |
1.44% |
4,272 |
|
|
|
2022 |
311,667 |
1.39% |
4,197 |
|
|
|
2023 |
315,864 |
1.35% |
4,152 |
25,403 |
41,873 |
Step 2: Determination of Average Household Size and Additional Households Required - Fingal County 2017 - 2023
Determination Method – determination of annual household increase based on the application of an average household size for the projected population.
Key Information Inputs – data input from Fingal County Council.
Table 2: Average Household Size and Additional Households Required - Fingal County 2017 2023
|
Year |
Fingal County Population - Total |
Number of Households (Private) |
Average Household Size |
Additional Houses Required Per Annum |
Total Additional Houses Required - 2017-2023 |
|---|---|---|---|---|---|
|
2017 |
290,462 |
99,455 |
2.92 |
1,404 |
- |
|
2018 |
294,582 |
100,987 |
2.92 |
1,532 |
- |
|
2019 |
298,761 |
102,543 |
2.91 |
1,555 |
- |
|
2020 |
303,018 |
104,129 |
2.91 |
1,586 |
- |
|
2021 |
307,395 |
105,760 |
2.91 |
1,631 |
- |
|
2022 |
311,667 |
107,359 |
2.90 |
1,599 |
- |
|
2023 |
315,864 |
108,919 |
2.90 |
1,559 |
10,866 |
Step 3: Calculation of Estimated Distribution of Household Disposable Incomes
Calculation Method – calculation of estimated distribution of household disposable incomes for 2011 for the 10 household deciles based on the weekly and annualised disposable incomes at national level and the adjusted to county level based on application of “inflator” rate.
Key Information Inputs – information/data inputs from DoE&LG “Part V of the Planning and Development Act, 2000, Housing Supply: A Model Housing Strategy and Step-by-Step Guide” (December, 2000), CSO “Household Budget Survey 2009-2010” (July 2012), CSO “County Incomes and Regional GDP 2011” (April, 2014).
|
Assumed Annual Percentage Income Increase from 2005 to 2010 |
Adjusted Average Weekly Disposable Income (State) (€) (2011) |
Percentage of Households in Each Category (State) |
Average Annual Disposable Income (State) (€) (2011) |
Fingal County Inflator |
Average Annual Disposable Income (Fingal County) (€) (2011) |
Number of Households in Fingal County (2011) |
|---|---|---|---|---|---|---|
|
3.76% |
196.02 |
11.57% |
10,193.05 |
1.119 |
11,409.47 |
10,777 |
|
4.60% |
314.84 |
10.54% |
16,371.68 |
1.119 |
18,325.45 |
9,818 |
|
4.02% |
448.61 |
9.48% |
23,327.82 |
1.119 |
26,111.73 |
8,830 |
|
2.49% |
562.90 |
9.60% |
29,270.75 |
1.119 |
32,763.89 |
8,942 |
|
1.31% |
678.23 |
9.74% |
35,267.91 |
1.119 |
39,476.74 |
9,072 |
|
0.59% |
807.30 |
9.56% |
41,979.71 |
1.119 |
46,989.51 |
8,905 |
|
0.45% |
976.36 |
9.81% |
50,770.85 |
1.119 |
56,829.78 |
9,138 |
|
0.28% |
1,187.12 |
9.58% |
61,730.31 |
1.119 |
69,097.13 |
8,923 |
|
0.73% |
1,483.42 |
9.78% |
77,137.80 |
1.119 |
86,343.33 |
9,110 |
|
0.51% |
2,301.15 |
10.34% |
119,659.74 |
1.119 |
133,939.79 |
9,631 |
|
|
|
100.00% |
|
|
|
93,146 |
Calculation Method – calculation of estimated distribution of household disposable incomes for 2011 for the 10 household deciles based on the weekly and annualised disposable incomes at national level and the adjusted to county level based on application of “inflator” rate.
Key Information Inputs – information/data inputs from DoE&LG “Part V of the Planning and Development Act, 2000, Housing Supply: A Model Housing Strategy and Step-by-Step Guide” (December, 2000), CSO “Household Budget Survey 2009-2010” (July 2012), CSO “County Incomes and Regional GDP 2011” (April, 2014).
Calculation of Fingal County Inflator
|
Disposable Income Per Person - State (2011) |
Disposable Income Per Person - Dublin City and County (2011) |
Fingal County Inflator |
|---|---|---|
|
- |
- |
- |
|
- |
- |
- |
|
- |
- |
- |
|
- |
- |
- |
|
- |
- |
- |
|
- |
- |
- |
|
- |
- |
- |
|
- |
- |
- |
|
- |
- |
- |
|
- |
- |
- |
|
19,055 |
21,329 |
1.119 |
Step 4: Calculation of Average Annual Household Disposable Income Distribution – Fingal County 2017 - 2023
Calculation Method – calculation of estimated distribution of household disposable incomes for 2017 - 2023 for the 10 household deciles based on the estimated distribution of household disposable incomes for 2011 and a forecast GNP growth rate.
Key Information Inputs – information/data inputs from DoE&LG “Part V of the Planning and Development Act, 2000, Housing Supply: A Model Housing Strategy and Step-by-Step Guide” (December, 2000), ESRI “Medium-Term Review - 2013-2020” (July 2013).
Table 4: Calculation of Average Annual Household Disposable Income Distribution
|
Year |
2017 |
2018 |
2019 |
2020 |
2021 |
2022 |
2023 |
|---|---|---|---|---|---|---|---|
|
% Growth |
4.0% |
3.4% |
3.2% |
3.6% |
2.2% |
2.2% |
2.2% |
|
1st Decile |
13,471 |
13,929 |
14,374 |
14,892 |
15,220 |
15,554 |
15,897 |
|
2nd Decile |
21,636 |
22,372 |
23,088 |
23,919 |
24,445 |
24,983 |
25,532 |
|
3rd Decile |
30,829 |
31,877 |
32,897 |
34,082 |
34,831 |
35,598 |
36,381 |
|
4th Decile |
38,683 |
39,998 |
41,278 |
42,764 |
43,705 |
44,666 |
45,649 |
|
5th Decile |
46,609 |
48,193 |
49,735 |
51,526 |
52,659 |
53,818 |
55,002 |
|
6th Decile |
55,479 |
57,365 |
59,201 |
61,332 |
62,681 |
64,060 |
65,469 |
|
7th Decile |
67,097 |
69,378 |
71,598 |
74,175 |
75,807 |
77,475 |
79,180 |
|
8th Decile |
81,580 |
84,354 |
87,053 |
90,187 |
92,171 |
94,199 |
96,271 |
|
9th Decile |
101,942 |
105,408 |
108,781 |
112,697 |
115,177 |
117,710 |
120,300 |
|
10th Decile |
158,137 |
163,514 |
168,746 |
174,821 |
178,667 |
182,598 |
186,615 |
Step 5: Calculation of Average Monthly Household Disposable Income Distribution – Fingal County 2017 - 2023
Calculation Method – calculation of estimated distribution of household disposable incomes for 2017-2023 for the 10 household deciles based on the calculation of the average annual household disposable incomes 2017-2023.
Key Information Inputs – information/data inputs from DoE&LG “Part V of the Planning and Development Act, 2000, Housing Supply: A Model Housing Strategy and Step-by-Step Guide” (December, 2000).
Table 5: Calculation of Average Monthly Household Disposable Income Distribution
|
Year |
2017 |
2018 |
2019 |
2020 |
2021 |
2022 |
2023 |
|
|---|---|---|---|---|---|---|---|---|
|
Range |
Percentage of Households in Each Category (Fingal County) |
|||||||
|
1st Decile |
11.57% |
1,123 |
1,161 |
1,198 |
1,241 |
1,268 |
1296 |
1,325 |
|
2nd Decile |
10.54% |
1,803 |
1,864 |
1,924 |
1,993 |
2,037 |
2082 |
2,128 |
|
3rd Decile |
9.48% |
2,569 |
2,656 |
2,741 |
2,840 |
2,903 |
2966 |
3,032 |
|
4th Decile |
9.60% |
3,224 |
3,333 |
3,440 |
3,564 |
3,642 |
3772 |
3,804 |
|
5th Decile |
9.74% |
3,884 |
4,016 |
4,145 |
4,294 |
4,388 |
4485 |
4,583 |
|
6th Decile |
9.56% |
4,623 |
4,780 |
4,933 |
5,111 |
5,223 |
5338 |
5,456 |
|
7th Decile |
9.81% |
5,591 |
5,781 |
5,966 |
6,181 |
6,317 |
6456 |
6,598 |
|
8th Decile |
9.58% |
6,798 |
7,029 |
7,254 |
7,516 |
7,681 |
7850 |
8,023 |
|
9th Decile |
9.78% |
8,495 |
8,784 |
9,065 |
9,391 |
9,598 |
9809 |
10,025 |
|
10th Decile |
10.34% |
13,178 |
13,626 |
14,062 |
14,568 |
14,889 |
15216 |
15,551 |
Step 6: Determination of Annual Income Distribution of Total Households – Fingal County 2017 - 2023
Determination Method – determination of annual income distribution of total household disposable incomes between the 10 household deciles for 2017-2023.
Key Information Inputs – information/data inputs from DoE&LG “Part V of the Planning and Development Act, 2000, Housing Supply: A Model Housing Strategy and Step-by-Step Guide” (December, 2000).
Table 6: Determination of Annual Income Distribution of Total Households
|
Year |
2017 |
2018 |
2019 |
2020 |
2021 |
2022 |
2023 |
|
|---|---|---|---|---|---|---|---|---|
|
Range |
Percentage of Households in Each Category (Fingal County) |
|||||||
|
1st Decile |
11.57% |
11,507 |
11,684 |
11,864 |
12,048 |
12,236 |
12421 |
12,602 |
|
2nd Decile |
10.54% |
10,483 |
10,644 |
10,808 |
10,975 |
11,147 |
11,316 |
11,480 |
|
3rd Decile |
9.48% |
9,428 |
9,574 |
9,721 |
9,871 |
10,026 |
10,178 |
10,325 |
|
4th Decile |
9.60% |
9,548 |
9,695 |
9,844 |
9,996 |
10,153 |
10,307 |
10,456 |
|
5th Decile |
9.74% |
9,687 |
9,836 |
9,988 |
10,142 |
10,301 |
10,457 |
10,609 |
|
6th Decile |
9.56% |
9,508 |
9,654 |
9,803 |
9,955 |
10,111 |
10,264 |
10,413 |
|
7th Decile |
9.81% |
9,757 |
9,907 |
10,059 |
10,215 |
10,375 |
10,532 |
10,685 |
|
8th Decile |
9.58% |
9,528 |
9,675 |
9,824 |
9,976 |
10,132 |
10,285 |
10,434 |
|
9th Decile |
9.78% |
9,727 |
9,877 |
10,029 |
10,184 |
10,343 |
10,500 |
10,652 |
|
10th Decile |
10.34% |
10,284 |
10,442 |
10,603 |
10,767 |
10,936 |
11,101 |
11,262 |
|
100.00% |
99,455 |
100,987 |
102,543 |
104,129 |
105,760 |
107,359 |
108,919 |
Step 7: Determination of Annual Income Distribution of Additional Households – Fingal County 2017 - 2023
Determination Method – determination of annual income distribution of new additional household disposable incomes between the 10 household deciles for 2017-2023.
Key Information Inputs – information/data inputs from DoE&LG “Part V of the Planning and Development Act, 2000, Housing Supply: A Model Housing Strategy and Step-by-Step Guide” (December, 2000).
Table 7: Determination of Annual Income Distribution of Additional Households - Fingal County - 2017-2023
|
Year |
2017 |
2018 |
2019 |
2020 |
2021 |
2022 |
2023 |
|
|---|---|---|---|---|---|---|---|---|
|
Income Range |
Percentage |
|||||||
|
1st Decile |
11.57% |
162 |
177 |
180 |
184 |
189 |
185 |
180 |
|
2nd Decile |
10.54% |
148 |
161 |
164 |
167 |
172 |
169 |
164 |
|
3rd Decile |
9.48% |
133 |
145 |
147 |
150 |
155 |
152 |
148 |
|
4th Decile |
9.60% |
135 |
147 |
149 |
152 |
157 |
154 |
150 |
|
5th Decile |
9.74% |
137 |
149 |
151 |
154 |
159 |
156 |
152 |
|
6th Decile |
9.56% |
134 |
146 |
149 |
152 |
156 |
153 |
149 |
|
7th Decile |
9.81% |
138 |
150 |
153 |
156 |
160 |
157 |
153 |
|
8th Decile |
9.58% |
135 |
147 |
149 |
152 |
156 |
153 |
149 |
|
9th Decile |
9.78% |
137 |
150 |
152 |
155 |
160 |
156 |
152 |
|
10th Decile |
10.34% |
145 |
158 |
161 |
164 |
169 |
165 |
161 |
|
100.00% |
1,404 |
1,532 |
1,555 |
1,586 |
1,631 |
1,599 |
1,559 |
Step 8: Calculation of Projected House Price Bands - Fingal County - 2008-2025
Calculation Method – calculation of projected house price bands based on the percentage split of the 8 price bands and a projected annual price increase or decrease for 2008-2025.
Key Information Inputs – information/data inputs from DoEC&LG “Database Direct for Housing Statistics ('Dublin Area' "Ranges of house prices") (October, 2015), CSO “House Price Index - 2008-2014” (2015), Davy “Property Price Outlook - 2015-2017” (September, 2013), Goodbody Economic Research “Irish Housing Market - From the ground up” (February, 2015).
Table 8: Calculation of Projected House Price Bands - Fingal County - 2008-2025
|
Year |
Average Price Increase/Decrease |
1st Band - not exceeding X1 |
2nd Band - X1-X2 |
3rd Band - X2-X3 |
4th Band - X3-X4 |
5th Band - X4-X5 |
6th Band - X5-X6 |
7th Band - X6-X7 |
8th Band - exceeding X7 |
|||||||
|---|---|---|---|---|---|---|---|---|---|---|---|---|---|---|---|---|
|
2008 |
- |
150,000 |
150,001 |
200,000 |
200,001 |
250,000 |
250,001 |
300,000 |
300,001 |
350,000 |
350,001 |
400,000 |
400,001 |
500,000 |
500,000 |
|
|
2009 |
-23.44% |
114,840 |
114,841 |
153,120 |
153,121 |
191,400 |
191,401 |
229,680 |
229,681 |
267,960 |
267,961 |
306,240 |
306,241 |
382,800 |
382,800 |
|
|
2010 |
-15.58% |
96,948 |
96,949 |
129,264 |
129,265 |
161,580 |
161,581 |
193,896 |
193,897 |
226,212 |
226,212 |
258,528 |
258,528 |
323,160 |
323,160 |
|
|
2011 |
-14.09% |
83,288 |
83,289 |
111,051 |
111,051 |
138,813 |
138,814 |
166,576 |
166,576 |
194,339 |
194,339 |
222,101 |
222,102 |
277,627 |
277,627 |
|
|
2012 |
-13.68% |
71,894 |
71,895 |
95,859 |
95,859 |
119,824 |
119,824 |
143,788 |
143,789 |
167,753 |
167,754 |
191,718 |
191,718 |
239,647 |
239,647 |
|
|
2013 |
7.38% |
77,200 |
77,200 |
102,933 |
102,934 |
128,667 |
128,667 |
154,400 |
154,400 |
180,133 |
180,134 |
205,867 |
205,867 |
257,333 |
257,333 |
|
|
2014 |
20.45% |
92,987 |
92,988 |
123,983 |
123,984 |
154,979 |
154,980 |
185,975 |
185,975 |
216,970 |
216,971 |
247,966 |
247,967 |
309,958 |
309,958 |
|
|
2015 |
9.00% |
101,356 |
101,357 |
135,142 |
135,142 |
168,927 |
168,928 |
202,712 |
202,713 |
236,498 |
236,499 |
270,283 |
270,284 |
337,854 |
337,854 |
|
|
2016 |
5.00% |
106,424 |
106,425 |
141,899 |
141,899 |
177,373 |
177,374 |
212,848 |
212,849 |
248,323 |
248,323 |
283,797 |
283,798 |
354,747 |
354,747 |
|
|
2017 |
4.00% |
110,681 |
110,682 |
147,575 |
147,575 |
184,468 |
184,469 |
221,362 |
221,363 |
258,256 |
258,256 |
295,149 |
295,150 |
368,937 |
368,937 |
|
|
2018 |
4.00% |
115,108 |
115,109 |
153,478 |
153,478 |
191,847 |
191,848 |
230,216 |
230,217 |
268,586 |
268,587 |
306,955 |
306,956 |
383,694 |
383,694 |
|
|
2019 |
4.00% |
119,713 |
119,713 |
159,617 |
159,618 |
199,521 |
199,522 |
239,425 |
239,426 |
279,329 |
279,330 |
319,233 |
319,234 |
399,042 |
399,042 |
|
|
2020 |
4.00% |
124,501 |
124,502 |
166,001 |
166,002 |
207,502 |
207,503 |
249,002 |
249,003 |
290,502 |
290,503 |
332,003 |
332,004 |
415,004 |
415,004 |
|
|
2021 |
4.00% |
129,481 |
129,482 |
172,641 |
172,642 |
215,802 |
215,803 |
258,962 |
258,963 |
302,123 |
302,123 |
345,283 |
345,284 |
431,604 |
431,604 |
|
|
2022 |
4.00% |
134,660 |
134,661 |
179,547 |
179,548 |
224,434 |
224,435 |
269,321 |
269,322 |
314,207 |
314,208 |
359,094 |
359,095 |
448,868 |
448,868 |
|
|
2023 |
4.00% |
140,047 |
140,048 |
186,729 |
186,730 |
233,411 |
233,412 |
280,094 |
280,094 |
326,776 |
326,777 |
373,458 |
373,459 |
466,823 |
466,823 |
|
|
2024 |
4.00% |
145,649 |
145,650 |
194,198 |
194,199 |
242,748 |
242,749 |
291,297 |
291,298 |
339,847 |
339,848 |
388,396 |
388,397 |
485,495 |
485,495 |
|
|
2025 |
4.00% |
151,475 |
151,476 |
201,966 |
201,967 |
252,458 |
252,459 |
302,949 |
302,950 |
353,441 |
353,442 |
403,932 |
403,933 |
504,915 |
504,915 |
|
|
% of Fingal County Housing Units within each Band (2008) - based on "Dublin Area" |
1.00% |
3.00% |
7.00% |
15.00% |
17.00% |
15.00% |
17.00% |
25.00% |
||||||||
Step 9: Application and Variables of the Annuity Formula
Application Method – apply the “Annuity Formula” based on the determination of an “Affordability Threshold”, a “Loan to Value Ratio”, an “Annual Percentage Rate (APR) - Interest Rate”, the determination of a “Monthly Percentage Rate (MPR) - Interest Rate”, and the determination of a “Loan Term (Years/Months)”.
Key Information Inputs – information/data inputs from DoE&LG “Part V of the Planning and Development Act, 2000, Housing Supply: A Model Housing Strategy and Step-by-Step Guide” (December, 2000).
Table 9: Application and Variables of the Annuity Formula
|
Affordability Threshold |
Loan to Value Ratio |
Annual Percentage Rate (APR) - Interest Rate |
Therefore Monthly Percentage Rate (MPR) - Interest Rate |
Loan Term (Years) |
Therefore Term Loan (Months) |
|---|---|---|---|---|---|
|
35.00% |
0.80 |
0.0395 |
0.003292 |
25 |
300 |
Step 10: Calculation of Housing Affordability - Fingal County - 2012-2025
Calculation Method – based on the application of the “Annuity Formula” calculate the housing affordability for each of the 10 household deciles for 2012-2025.
Key Information Inputs – information/data inputs from DoE&LG “Part V of the Planning and Development Act, 2000, Housing Supply: A Model Housing Strategy and Step-by-Step Guide” (December, 2000).
Table 10: Calculation of Housing Affordability - Fingal County - 2012-2025
|
YEAR |
2012 |
2013 |
2014 |
2015 |
2016 |
2017 |
2018 |
2019 |
2020 |
2021 |
2022 |
2023 |
2024 |
2025 |
|
|---|---|---|---|---|---|---|---|---|---|---|---|---|---|---|---|
|
Range |
Percentage of Households in Each Category (Fingal County) |
Approximate Affordable House Price - Fingal County - 2012-2025 (€) |
|||||||||||||
|
1st Decile |
11.57% |
81,835 |
82,817 |
83,231 |
86,810 |
89,935 |
93,532 |
96,712 |
99,807 |
103,400 |
105,675 |
108,000 |
110,376 |
112,804 |
115,286 |
|
2nd Decile |
10.54% |
131,440 |
133,017 |
133,682 |
139,430 |
144,450 |
150,228 |
155,336 |
160,306 |
166,077 |
169,731 |
173,465 |
177,281 |
181,182 |
185,168 |
|
3rd Decile |
9.48% |
187,287 |
189,534 |
190,482 |
198,673 |
205,825 |
214,058 |
221,336 |
228,419 |
236,642 |
241,848 |
247,168 |
252,606 |
258,164 |
263,843 |
|
4th Decile |
9.60% |
235,000 |
237,820 |
239,009 |
249,286 |
258,260 |
268,591 |
277,723 |
286,610 |
296,928 |
303,460 |
310,136 |
316,959 |
323,933 |
331,059 |
|
5th Decile |
9.74% |
283,148 |
286,545 |
287,978 |
300,361 |
311,174 |
323,621 |
334,624 |
345,332 |
357,764 |
365,635 |
373,679 |
381,900 |
390,302 |
398,888 |
|
6th Decile |
9.56% |
337,033 |
341,078 |
342,783 |
357,523 |
370,393 |
385,209 |
398,306 |
411,052 |
425,850 |
435,219 |
444,793 |
454,579 |
464,580 |
474,800 |
|
7th Decile |
9.81% |
407,613 |
412,504 |
414,566 |
432,393 |
447,959 |
465,877 |
481,717 |
497,132 |
515,029 |
526,360 |
537,939 |
549,774 |
561,869 |
574,230 |
|
8th Decile |
9.58% |
495,600 |
501,548 |
504,055 |
525,730 |
544,656 |
566,442 |
585,701 |
604,444 |
626,204 |
639,980 |
654,060 |
668,449 |
683,155 |
698,184 |
|
9th Decile |
9.78% |
619,299 |
626,731 |
629,864 |
656,949 |
680,599 |
707,823 |
731,889 |
755,309 |
782,500 |
799,715 |
817,309 |
835,290 |
853,666 |
872,447 |
|
10th Decile |
10.34% |
960,686 |
972,214 |
977,075 |
1,019,089 |
1,055,776 |
1,098,007 |
1,135,340 |
1,171,670 |
1,213,851 |
1,240,555 |
1,267,848 |
1,295,740 |
1,324,246 |
1,353,380 |
Step 11: Calculation of Projected Social Housing Need - Fingal County - 2012-2025
Calculation Method – based on the determination of additional households required, the projected house price bands and the housing affordability, calculate the number of households not meeting the “Affordability Criteria” for 2012-2025.
Key Information Inputs – information/data inputs from DoE&LG “Part V of the Planning and Development Act, 2000, Housing Supply: A Model Housing Strategy and Step-by-Step Guide” (December, 2000). “Database Direct for Housing Statistics ('Dublin Area' "Ranges of house prices") (October, 2015).
Table 11: Calculation of Projected Social Housing Need - Fingal County 2012-2025
|
Year |
Range |
No. of Households Required |
Runnig Total |
Affordability by each Decile |
Household Band Position |
House Prices Bands - Upper Value |
No. of Houses Required within each Band |
% of Housing Units Projected to be Provided within each Band |
No. Housing Units Projected to be Provided within each Band |
Housing Shortfall - i.e. No. of Households Meeting Affordability Criteria |
Housing Shortfall as a % of Total Households Required |
|---|---|---|---|---|---|---|---|---|---|---|---|
|
2012 |
1st Decile |
80 |
80 |
81,835 |
1st & 2nd Bands |
95,859 |
112 |
4.00% |
28 |
84 |
12.12% |
|
2nd Decile |
73 |
154 |
131,440 |
3rd & 4th Bands |
143,788 |
56 |
22.00% |
153 |
-96 |
- |
|
|
3rd Decile |
66 |
219 |
187,287 |
5th & 6th Bands |
191,718 |
65 |
32.00% |
222 |
-157 |
- |
|
|
4th Decile |
67 |
286 |
235,000 |
7th Band |
239,647 |
66 |
17.00% |
118 |
-52 |
- |
|
|
5th Decile |
68 |
354 |
283,148 |
8th Band |
None |
- |
25.00% |
174 |
- |
- |
|
|
6th Decile |
66 |
420 |
337,033 |
||||||||
|
7th Decile |
68 |
488 |
407,613 |
||||||||
|
8th Decile |
67 |
555 |
495,600 |
||||||||
|
9th Decile |
68 |
623 |
619,299 |
||||||||
|
10th Decile |
72 |
695 |
960,686 |
||||||||
|
695 |
100.00% |
695 |
12.12% |
||||||||
|
2013 |
1st Decile |
91 |
91 |
82,817 |
1st & 2nd Bands |
102,933 |
134 |
4.00% |
31 |
103 |
13.11% |
|
2nd Decile |
83 |
173 |
133,017 |
3rd & 4th Bands |
154,400 |
68 |
22.00% |
172 |
-105 |
- |
|
|
3rd Decile |
74 |
247 |
189,534 |
5th & 6th Bands |
205,867 |
78 |
32.00% |
251 |
-173 |
- |
|
|
4th Decile |
75 |
322 |
237,820 |
7th Band |
257,333 |
79 |
17.00% |
133 |
-54 |
- |
|
|
5th Decile |
76 |
399 |
286,545 |
8th Band |
None |
- |
25.00% |
196 |
- |
- |
|
|
6th Decile |
75 |
474 |
341,078 |
||||||||
|
7th Decile |
77 |
550 |
412,504 |
||||||||
|
8th Decile |
75 |
625 |
501,548 |
||||||||
|
9th Decile |
77 |
702 |
626,731 |
||||||||
|
10th Decile |
81 |
783 |
972,214 |
||||||||
|
783 |
100.00% |
783 |
13.11% |
|
Year |
Range |
No. of Households Required |
Runnig Total |
Affordability by each Decile |
Household Band Position |
House Prices Bands - Upper Value |
No. of Houses Required within each Band |
% of Housing Units Projected to be Provided within each Band |
No. Housing Units Projected to be Provided within each Band |
Housing Shortfall - i.e. No. of Households Meeting Affordability Criteria |
Housing Shortfall as a % of Total Households Required |
|---|---|---|---|---|---|---|---|---|---|---|---|
|
2014 |
1st Decile |
113 |
113 |
83,231 |
1st Band |
92,987 |
150 |
1.00% |
10 |
140 |
14.38% |
|
2nd Decile |
103 |
215 |
133,682 |
2nd & 3rd Bands |
154,979 |
100 |
10.00% |
97 |
3 |
0.32% |
|
|
3rd Decile |
92 |
307 |
190,482 |
4th & 5th Bands |
216,970 |
114 |
32.00% |
311 |
-198 |
- |
|
|
4th Decile |
93 |
401 |
239,009 |
6th Band |
247,966 |
63 |
15.00% |
146 |
-83 |
- |
|
|
5th Decile |
95 |
495 |
287,978 |
7th Band |
309,958 |
105 |
17.00% |
165 |
-60 |
- |
|
|
6th Decile |
93 |
588 |
342,783 |
8th Band |
None |
- |
25.00% |
243 |
- |
- |
|
|
7th Decile |
95 |
684 |
414,566 |
||||||||
|
8th Decile |
93 |
777 |
504,055 |
||||||||
|
9th Decile |
95 |
872 |
629,864 |
||||||||
|
10th Decile |
101 |
973 |
977,075 |
||||||||
|
973 |
100.00% |
973 |
14.70% |
||||||||
|
2015 |
1st Decile |
133 |
133 |
86,810 |
1st Band |
101,356 |
184 |
1.00% |
11 |
173 |
15.07% |
|
2nd Decile |
121 |
254 |
139,430 |
2nd & 3rd Bands |
168,927 |
124 |
10.00% |
115 |
9 |
0.79% |
|
|
3rd Decile |
109 |
362 |
198,673 |
4th Band |
202,712 |
76 |
15.00% |
172 |
-96 |
- |
|
|
4th Decile |
110 |
472 |
249,286 |
5th & 6th Bands |
270,283 |
141 |
32.00% |
367 |
-225 |
- |
|
|
5th Decile |
112 |
584 |
300,361 |
7th Band |
337,854 |
130 |
17.00% |
195 |
-65 |
- |
|
|
6th Decile |
110 |
694 |
357,523 |
8th Band |
None |
- |
25.00% |
287 |
- |
- |
|
|
7th Decile |
112 |
806 |
432,393 |
||||||||
|
8th Decile |
110 |
916 |
525,730 |
||||||||
|
9th Decile |
112 |
1,028 |
656,949 |
||||||||
|
10th Decile |
119 |
1,147 |
1,019,089 |
||||||||
|
10th Decile |
72 |
695 |
960,686 |
||||||||
|
1,147 |
100.00% |
1,147 |
15.86% |
|
Year |
Range |
No. of Households Required |
Runnig Total |
Affordability by each Decile |
Household Band Position |
House Prices Bands - Upper Value |
No. of Houses Required within each Band |
% of Housing Units Projected to be Provided within each Band |
No. Housing Units Projected to be Provided within each Band |
Housing Shortfall - i.e. No. of Households Meeting Affordability Criteria |
Housing Shortfall as a % of Total Households Required |
|---|---|---|---|---|---|---|---|---|---|---|---|
|
2016 |
1st Decile |
151 |
151 |
89,935 |
1st Band |
106,424 |
213 |
1.00% |
13 |
200 |
15.29% |
|
2nd Decile |
138 |
289 |
144,450 |
2nd & 3rd Bands |
177,373 |
143 |
10.00% |
131 |
12 |
0.93% |
|
|
3rd Decile |
124 |
413 |
205,825 |
4th Band |
212,848 |
88 |
15.00% |
196 |
-108 |
- |
|
|
4th Decile |
126 |
539 |
258,260 |
5th & 6th Bands |
283,797 |
164 |
32.00% |
419 |
-255 |
- |
|
|
5th Decile |
127 |
666 |
311,174 |
7th Band |
354,747 |
150 |
17.00% |
222 |
-72 |
- |
|
|
6th Decile |
125 |
791 |
370,393 |
8th Band |
None |
- |
25.00% |
327 |
- |
- |
|
|
7th Decile |
128 |
920 |
447,959 |
||||||||
|
8th Decile |
125 |
1,045 |
544,656 |
||||||||
|
9th Decile |
128 |
1,173 |
680,599 |
||||||||
|
10th Decile |
135 |
1,308 |
1,055,776 |
||||||||
|
1,308 |
100.00% |
1,308 |
16.22% |
||||||||
|
2017 |
1st Decile |
162 |
162 |
93,532 |
1st Band |
110,681 |
229 |
1.00% |
14 |
215 |
15.29% |
|
2nd Decile |
148 |
310 |
150,228 |
2nd & 3rd Bands |
184,468 |
154 |
10.00% |
140 |
13 |
0.93% |
|
|
3rd Decile |
133 |
444 |
214,058 |
4th Band |
221,362 |
94 |
15.00% |
211 |
-116 |
- |
|
|
4th Decile |
135 |
578 |
268,591 |
5th & 6th Bands |
295,149 |
176 |
32.00% |
449 |
-274 |
- |
|
|
5th Decile |
137 |
715 |
323,621 |
7th Band |
368,937 |
161 |
17.00% |
239 |
-77 |
- |
|
|
6th Decile |
134 |
849 |
385,209 |
th Band |
None |
- |
25.00% |
351 |
- |
- |
|
|
7th Decile |
138 |
987 |
465,877 |
||||||||
|
8th Decile |
135 |
1,122 |
566,442 |
||||||||
|
9th Decile |
137 |
1,259 |
707,823 |
||||||||
|
10th Decile |
145 |
1,404 |
1,098,007 |
||||||||
|
1,404 |
100.00% |
1,404 |
16.22% |
|
Year |
Range |
No. of Households Required |
Runnig Total |
Affordability by each Decile |
Household Band Position |
House Prices Bands - Upper Value |
No. of Houses Required within each Band |
% of Housing Units Projected to be Provided within each Band |
No. Housing Units Projected to be Provided within each Band |
Housing Shortfall - i.e. No. of Households Meeting Affordability Criteria |
Housing Shortfall as a % of Total Households Required |
|---|---|---|---|---|---|---|---|---|---|---|---|
|
2018 |
1st Decile |
177 |
177 |
96,712 |
1st Band |
115,108 |
251 |
1.00% |
15 |
236 |
15.38% |
|
2nd Decile |
161 |
339 |
155,336 |
2nd & 3rd Bands |
191,847 |
168 |
10.00% |
153 |
15 |
1.00% |
|
|
3rd Decile |
145 |
484 |
221,336 |
4th Band |
230,216 |
104 |
15.00% |
230 |
-126 |
- |
|
|
4th Decile |
147 |
631 |
277,723 |
5th & 6th Bands |
306,955 |
193 |
32.00% |
490 |
-298 |
- |
|
|
6th Decile |
146 |
927 |
398,306 |
8th Band |
None |
- |
25.00% |
383 |
- |
- |
|
|
7th Decile |
150 |
1,077 |
481,717 |
||||||||
|
8th Decile |
147 |
1,224 |
585,701 |
||||||||
|
9th Decile |
150 |
1,374 |
731,889 |
||||||||
|
10th Decile |
158 |
1,532 |
1,135,340 |
||||||||
|
1,532 |
100.00% |
1,532 |
16.38% |
||||||||
|
2019 |
1st Decile |
180 |
180 |
99,807 |
1st Band |
119,713 |
257 |
1.00% |
16 |
241 |
15.51% |
|
2nd Decile |
164 |
344 |
160,306 |
2nd & 3rd Bands |
199,521 |
172 |
10.00% |
156 |
17 |
1.08% |
|
|
3rd Decile |
147 |
491 |
228,419 |
4th Band |
239,425 |
106 |
15.00% |
233 |
-127 |
- |
|
|
4th Decile |
149 |
641 |
286,610 |
5th & 6th Bands |
319,233 |
197 |
32.00% |
498 |
-301 |
- |
|
|
5th Decile |
151 |
792 |
345,332 |
7th Band |
399,042 |
181 |
17.00% |
264 |
-83 |
- |
|
|
6th Decile |
149 |
941 |
411,052 |
8th Band |
None |
- |
25.00% |
389 |
- |
- |
|
|
7th Decile |
153 |
1,093 |
497,132 |
||||||||
|
8th Decile |
149 |
1,242 |
604,444 |
||||||||
|
9th Decile |
152 |
1,395 |
755,309 |
||||||||
|
10th Decile |
161 |
1,555 |
1,171,670 |
||||||||
|
10th Decile |
72 |
695 |
960,686 |
||||||||
|
1,555 |
100.00% |
1,555 |
16.59% |
|
Year |
Range |
No. of Households Required |
Runnig Total |
Affordability by each Decile |
Household Band Position |
House Prices Bands - Upper Value |
No. of Houses Required within each Band |
% of Housing Units Projected to be Provided within each Band |
No. Housing Units Projected to be Provided within each Band |
Housing Shortfall - i.e. No. of Households Meeting Affordability Criteria |
Housing Shortfall as a % of Total Households Required |
|---|---|---|---|---|---|---|---|---|---|---|---|
|
2020 |
1st Decile |
184 |
184 |
103,400 |
1st Band |
124,501 |
263 |
1.00% |
16 |
247 |
15.57% |
|
2nd Decile |
167 |
351 |
166,077 |
2nd & 3rd Bands |
207,502 |
176 |
10.00% |
159 |
18 |
1.13% |
|
|
3rd Decile |
150 |
501 |
236,642 |
4th Band |
249,002 |
109 |
15.00% |
238 |
-129 |
- |
|
|
4th Decile |
152 |
653 |
296,928 |
5th & 6th Bands |
332,003 |
202 |
32.00% |
508 |
-306 |
- |
|
|
6th Decile |
152 |
959 |
425,850 |
7th Band |
415,004 |
185 |
17.00% |
270 |
- |
- |
|
|
7th Decile |
156 |
1,115 |
515,029 |
8th Band |
None |
- |
25.00% |
397 |
- |
- |
|
|
8th Decile |
152 |
1,267 |
626,204 |
||||||||
|
9th Decile |
155 |
1,422 |
782,500 |
||||||||
|
10th Decile |
164 |
1,586 |
1,213,851 |
||||||||
|
10th Decile |
135 |
1,308 |
1,055,776 |
||||||||
|
1,586 |
100.00% |
1,586 |
16.70% |
||||||||
|
2021 |
1st Decile |
162 |
162 |
93,532 |
1st Band |
110,681 |
229 |
1.00% |
14 |
215 |
15.29% |
|
2nd Decile |
148 |
310 |
150,228 |
2nd & 3rd Bands |
184,468 |
154 |
10.00% |
140 |
13 |
0.93% |
|
|
3rd Decile |
133 |
444 |
214,058 |
4th Band |
221,362 |
94 |
15.00% |
211 |
-116 |
- |
|
|
4th Decile |
135 |
578 |
268,591 |
5th & 6th Bands |
295,149 |
176 |
32.00% |
449 |
-274 |
- |
|
|
5th Decile |
137 |
715 |
323,621 |
7th Band |
368,937 |
161 |
17.00% |
239 |
-77 |
- |
|
|
6th Decile |
134 |
849 |
385,209 |
8th Band |
None |
- |
25.00% |
351 |
- |
- |
|
|
7th Decile |
138 |
987 |
465,877 |
||||||||
|
8th Decile |
135 |
1,122 |
566,442 |
||||||||
|
9th Decile |
137 |
1,259 |
707,823 |
||||||||
|
10th Decile |
145 |
1,404 |
1,098,007 |
||||||||
|
1,404 |
100.00% |
1,404 |
16.22% |
|
Year |
Range |
No. of Households Required |
Runnig Total |
Affordability by each Decile |
Household Band Position |
House Prices Bands - Upper Value |
No. of Houses Required within each Band |
% of Housing Units Projected to be Provided within each Band |
No. Housing Units Projected to be Provided within each Band |
Housing Shortfall - i.e. No. of Households Meeting Affordability Criteria |
Housing Shortfall as a % of Total Households Required |
|---|---|---|---|---|---|---|---|---|---|---|---|
|
2022 |
1st Decile |
185 |
185 |
108,000 |
1st Band |
134,660 |
274 |
1.00% |
16 |
258 |
16.16% |
|
2nd Decile |
169 |
354 |
173,465 |
2nd Band |
179,547 |
92 |
3.00% |
48 |
45 |
2.78% |
|
|
3rd Decile |
152 |
505 |
247,168 |
3rd & 4th Bands |
269,321 |
205 |
22.00% |
352 |
-147 |
- |
|
|
4th Decile |
154 |
659 |
310,136 |
5th Band |
314,207 |
113 |
17.00% |
272 |
-159 |
- |
|
|
5th Decile |
159 |
831 |
365,635 |
6th & 7th Bands |
448,868 |
253 |
32.00% |
512 |
-259 |
- |
|
|
6th Decile |
156 |
987 |
435,219 |
||||||||
|
7th Decile |
160 |
1,147 |
526,360 |
8th Band |
None |
- |
25.00% |
400 |
- |
- |
|
|
8th Decile |
156 |
1,303 |
639,980 |
||||||||
|
9th Decile |
160 |
1,463 |
799,715 |
||||||||
|
10th Decile |
169 |
1,631 |
1,240,555 |
||||||||
|
1,599 |
100.00% |
1,599 |
18.95% |
||||||||
|
2023 |
1st Decile |
180 |
180 |
110,376 |
1st Band |
140,047 |
272 |
1.00% |
16 |
257 |
16.47% |
|
2nd Decile |
164 |
345 |
177,281 |
2nd Band |
186,729 |
92 |
3.00% |
47 |
45 |
2.89% |
|
|
3rd Decile |
148 |
493 |
252,606 |
3rd & 4th Bands |
280,094 |
203 |
22.00% |
343 |
-140 |
- |
|
|
4th Decile |
150 |
642 |
316,959 |
5th Band |
326,776 |
112 |
17.00% |
265 |
-153 |
- |
|
|
5th Decile |
152 |
794 |
381,900 |
6th & 7th Bands |
466,823 |
251 |
32.00% |
499 |
-248 |
- |
|
|
6th Decile |
149 |
943 |
454,579 |
||||||||
|
7th Decile |
153 |
1,096 |
549,774 |
8th Band |
None |
- |
25.00% |
390 |
- |
- |
|
|
8th Decile |
149 |
1,246 |
668,449 |
||||||||
|
9th Decile |
152 |
1,398 |
835,290 |
||||||||
|
10th Decile |
161 |
1,559 |
1,295,740 |
||||||||
|
10th Decile |
72 |
695 |
960,686 |
||||||||
|
1,559 |
100.00% |
1,559 |
19.35% |
|
Year |
Range |
No. of Households Required |
Runnig Total |
Affordability by each Decile |
Household Band Position |
House Prices Bands - Upper Value |
No. of Houses Required within each Band |
% of Housing Units Projected to be Provided within each Band |
No. Housing Units Projected to be Provided within each Band |
Housing Shortfall - i.e. No. of Households Meeting Affordability Criteria |
Housing Shortfall as a % of Total Households Required |
|---|---|---|---|---|---|---|---|---|---|---|---|
|
2024 |
1st Decile |
166 |
166 |
112,804 |
1st Band |
145,649 |
254 |
1.00% |
14 |
240 |
16.77% |
|
2nd Decile |
151 |
317 |
181,182 |
2nd Band |
194,198 |
86 |
3.00% |
43 |
43 |
2.99% |
|
|
3rd Decile |
136 |
452 |
258,164 |
3rd & 4th Bands |
291,297 |
190 |
22.00% |
315 |
-125 |
- |
|
|
4th Decile |
137 |
590 |
323,933 |
5th Band |
339,847 |
105 |
17.00% |
243 |
-139 |
- |
|
|
5th Decile |
139 |
729 |
390,302 |
6th & 7th Bands |
485,495 |
270 |
32.00% |
458 |
- |
- |
|
|
6th Decile |
137 |
866 |
464,580 |
||||||||
|
7th Decile |
140 |
1,007 |
561,869 |
8th Band |
None |
- |
25.00% |
358 |
- |
- |
|
|
8th Decile |
137 |
1,144 |
683,155 |
||||||||
|
9th Decile |
140 |
1,284 |
853,666 |
||||||||
|
10th Decile |
148 |
1,432 |
1,324,246 |
||||||||
|
1,432 |
100.00% |
1,432 |
19.76% |
||||||||
|
2025 |
1st Decile |
165 |
165 |
115,286 |
1st Band |
151,475 |
257 |
1.00% |
14 |
243 |
17.09% |
|
2nd Decile |
150 |
315 |
185,168 |
2nd Band |
201,966 |
87 |
3.00% |
43 |
44 |
3.09% |
|
|
3rd Decile |
135 |
449 |
263,843 |
3rd & 4th Bands |
302,949 |
192 |
22.00% |
313 |
-121 |
- |
|
|
4th Decile |
137 |
586 |
331,059 |
5th Band |
353,441 |
106 |
17.00% |
242 |
-136 |
- |
|
|
5th Decile |
139 |
724 |
398,888 |
6th Band |
403,932 |
90 |
15.00% |
213 |
-123 |
- |
|
|
6th Decile |
136 |
860 |
474,800 |
7th Band |
504,915 |
147 |
17.00% |
242 |
-95 |
- |
|
|
7th Decile |
140 |
1,000 |
574,230 |
8th Band |
None |
- |
25.00% |
356 |
- |
- |
|
|
8th Decile |
136 |
1,136 |
698,184 |
||||||||
|
9th Decile |
139 |
1,275 |
872,447 |
||||||||
|
10th Decile |
147 |
1,422 |
1,353,380 |
||||||||
|
1,422 |
100.00% |
1,422 |
20.18% |
Step 12: Summary of Projected Social Housing Need - Fingal County - 2017-2023
Determination Method – based on the application of the “Annuity Formula” calculate the housing affordability for each of the 10 household deciles for 2017-2023.
Key Information Inputs – information/data inputs from Fingal County Council, DoE&LG “Part V of the Planning and Development Act, 2000, Housing Supply: A Model Housing Strategy and Step-by-Step Guide” (December, 2000).
The table below sets out the annual determined new household formations in Fingal County and the associated projected social housing requirements for the period 2017 to 2023. The annual social household units and related percentage shortfall range from between 215 and 257 units and 15.29% and 16.47%, respectively. These annual household units reflect the projected extent of ‘housing need’ arising for households in Fingal County that are additional to the current extent of unmet need. In effect, these household units are the net annual increase projected for social housing.
Table 12: Summary of Projected Social Housing Need - Fingal County - 2017-2023
|
2017 |
2018 |
2019 |
2020 |
2021 |
2022 |
2023 |
|
|---|---|---|---|---|---|---|---|
|
New Household Formations |
1,404 |
1,532 |
1,555 |
1,586 |
1,631 |
1,599 |
1,559 |
|
Social Housing Requirement |
215 |
236 |
241 |
247 |
259 |
258 |
257 |
|
Housing Shortfall as a % of Total Households Required |
15.29% |
15.38% |
15.51% |
15.57% |
15.87% |
16.16% |
16.47% |
The projected ‘housing need’ is based on the relationship between the following key variables:
- Annual population projections, determination of average household size and the resulting number of additional households required to accommodate the projected growth;
- Assessment of the levels of projected household disposal income; and,
- Projection of annual house price change.
Based on these variables and the application of the standard “best practice”, housing analysis modelling enables the determination of the number of projected households that will not be in a position to afford the market purchase of a housing unit in a given year, and this is expressed as the number of housing units required to be provided socially, as set out in the table above.
Analysis of Social Housing Demand and Supply
The provision of social housing for those who are unable to provide housing for themselves remains a high priority. This can be achieved by providing income support to secure and to retain private accommodation and provision of social housing. The aim would be for every household that has a need, to be able to access an affordable home of good quality which is suited to their needs and in a secure environment.
Fingal County Council strives to fulfil this aim by:
- Construction and purchase of new accommodation/second hand
- Provision of social housing in partnership with Approved Housing Bodies
- Provision of social houses under Part V of the Planning & Development Acts & Urban Regeneration and Housing Act 2015
- The Rental Accommodation Scheme (RAS)
- Long-Term Leasing (LTL)
- Housing Assistance Payment
- Optimum management of existing housing stock
Rental Accommodation Scheme (RAS)
RAS is designed to provide security of tenure in good quality accommodation for eligible tenants in the private rented sector. Under RAS, eligible tenants and their landlords become RAS clients. Eligible tenants are those in receipt of Rent Supplement for more than 18 months and in need of long-term housing. The rent negotiated between the Council and the landlord is paid monthly by the Council directly to the landlord for the duration of the RAS contract.
The tenant contributes to the rent but pays it to the Local Authority, not the landlord. Under RAS the landlord and tenant retain all duties and responsibilities under Landlord and Tenant law. The Residential Tenancies Act 2004 governs the relationship between the landlord and the tenant. Under RAS Local Authorities make agreements with private landlords (or voluntary bodies) to provide accommodation on a medium-to-long-term basis, i.e. a 4-year agreement or a 10 year agreement.
Housing Assistance Payment (HAP)
It is expected that HAP - will be rolled out by Fingal County Council in 2016. The Government acknowledged in the Housing Policy Statement that Rent Supplement, which was always intended as a short-term income support, had actually become a long-term social housing support.
The introduction of HAP will mean that local authorities can now provide housing assistance for households who qualify for social housing support, including many long-term rent supplement recipients. Under HAP, Local Authorities will make the full rent payment on behalf of the HAP recipient directly to the landlord. The HAP recipient will then pay a rent contribution to the Local Authorities. The rent contribution is a differential rent – that is, a rent based on income and the ability to pay.
There are currently 5,348 households in receipt of rent supplement in the Fingal area.
Social Housing Leasing Initiative (SHLI)
In order to increase the availability of properties for social housing provision, the DoECLG, launched the SHLI in 2009. This involves Housing Authorities leasing properties from private property owners for the purposes of providing accommodation to households on social housing waiting lists. Leasing introduces greater flexibility in the composition of the housing stock and provides the opportunity for housing authorities to benefit from market conditions to increase output and meet housing need in a cost effective manner.
Access to housing stock is achieved through a number of ways:
- Local Authorities leasing properties from private property owners for periods of 10-20 years under the Long Term Leasing (LTL) scheme
- Approved Housing Bodies leasing from property owners, purchasing on the market or constructing properties and making them available for social housing provision through direct agreements with the DoECLG.
- Local Authorities temporarily utilising unsold affordable housing stock.
Approved Housing Bodies (AHBs)
The Social Housing Strategy 2020 envisages an enhanced role for the AHBs in the provision of social housing supports in the future. New financial mechanisms were introduced in 2011 (CALF and P&A Agreements) to facilitate borrowing for the supply of new social housing units by the AHBs.
A consultation process took place between the AHBs and the Council as part of the development of this Strategy. A number of Approved Housing Bodies submitted their views on how Fingal County Council could best address the current housing demand. Amongst the detailed responses received were:
- Continued collaboration between Fingal , AHBs and developers to deliver units through Part V and CAS/CALF
- Partnerships between AHBs to provide social housing units
- Support and priority for those with a special housing need in particular with regard to location and accessibility.
The Council will continue to work in partnership with the AHB sector in order to fully realise its capabilities in social housing management and acquisition.
Provision of Social Housing
There are 9,103 households on the Fingal Social Housing List (November 2015). The estimate of the required projected supply of social housing provision for Fingal County Council for the period 2016 – 2023 has been projected as being 1,913 households. This realises a need of 11,016 social housing units over the period 2016 – 2023.
The targets for delivery of Social Housing Strategy 2015 – 2017 as set out by the DOECLG in April 2015 outlined a target of 1,376 social housing units to be provided by Fingal County Council. The Council projects that 1,611 units will be provided in the County during this timeframe. These units will be provided under various headings such as HAP, Part V, Construction, Acquisitions and by Approved Housing Bodies. Using this delivery method, the Council anticipates that a further 9,403 social housing units will be delivered to meet the projected need for the period 2018 – 2023.
The following table provides detail of the delivery of social housing units for 2016 – 2023.
|
Social Housing Demand 2017 – 2023 |
|
|---|---|
|
2016 – 2023 social housing need |
1,913 |
|
Current social housing list @ Nov 2015 |
9,103 |
|
TOTAL |
11,016 |
|
Social Housing Demand 2017 – 2023 |
|
|---|---|
|
Targets for delivery to end 2017 |
1,611 |
|
Housing Assistance Payment, RAS + LTL |
5,348 |
|
RAS + LTL |
566 |
|
Part V |
1,800 |
|
Construction FCC |
390 |
|
Acquisitions FCC |
352 |
|
Approved Housing Bodies |
1,214 |
|
TOTAL |
11,281 |
It should be noted that delivery of units via the schemes outlined is dependent on sufficient funding being made available from central Government and the implementation of the Housing Assistance Payment Scheme in the Fingal area. The delivery of units via Part V is dependent on the continued increase in private house construction in the County.
Specific Social Housing Needs
Homeless Accommodation Supply and Demand
The Dublin Regional Homeless Executive is a shared service operating under the aegis of Dublin City Council, as the lead statutory authority in the Dublin region, in respect of the co-ordination of responses to Homelessness.
The provision of all emergency accommodation is provided by the Dublin Regional Homeless Executive Central Placement Service on behalf of the four Dublin Local Authorities who work closely together on a daily basis in order to respond to emergency need. All requests for emergency accommodation for clients assessed as homeless are made by Fingal County Council in collaboration with the Central Placement Service.
The Sustaining the Pathway to Home - Homeless Action Plan Framework for Dublin 2014-2016 was developed throughout 2013, by the Dublin Joint Homeless Consultative Forum and Statutory Management Group. It was informed by submissions from members of the public, including community and voluntary agencies alongside elected representatives and most importantly homeless service users themselves.
The plan sets out the strategic aims for core actions that are required to address regional objectives. Partnership and collaborative working between the voluntary and statutory sections is vital to delivering the strategic aims set out in the Framework Action Plan and this work is continuing.
Key Points of Pathways to Home Model
- Prevention of homelessness in the first instance
- Effective response to the homeless through holistic assessment following contact
- Providing that there is a care and case management approach towards a person’s move to independent living with supports
Traveller Accommodation
The Housing (Traveller Accommodation) Act 1998 requires Housing Authorities in consultation with travellers and with the general public to prepare and adopt a five year Traveller Accommodation Programme (by resolution of the elected members of the Council) to meet the existing and projected needs of travellers in the area.
A census carried out by Fingal County Council in November 2014 showed that there were 456 Travelling Families living in the County. A new census is scheduled to be carried out in December 2015.
The County’s Traveller Accommodation Programme 2014-2018 sets Council policy regarding the provision of traveller accommodation and also through an assessment of accommodation needs.
Annual Targets for Traveller Accommodation
The annual targets for the delivery of Traveller specific accommodation are shown in in the table below.
Traveller Specific accommodation – Annual Targets
|
Number of Units |
|||||
|---|---|---|---|---|---|
|
2014 |
2015 |
2016 |
2017 |
2018 |
|
|
Group Housing (new) |
16 |
12 |
14 |
30 |
|
|
Group Housing (refurbishment)
|
6 |
4 |
9 |
4 |
|
|
Halting Site (refurbishment)
|
11 |
25 |
5 |
||
|
Total |
17 |
46 |
26 |
18 |
30 |
Source: Fingal County Council Traveller Accommodation Programme 2014 – 2018
The Assessment of Needs survey completed for the Traveller Accommodation Programme 2014-2018 indicated that 411 Traveller families resided in Fingal during this period. All families were surveyed and 303 of the total families (74% return) canvassed expressed varying preferences for accommodation within Fingal County.
Housing Preferences of Traveller Families
|
Remain in Current Accommodation |
Standard Housing |
Group Housing |
Halting Sites |
|
|---|---|---|---|---|
|
Number of Families |
147 |
100 |
50 |
6 |
|
Percentage |
49% |
33% |
17% |
2% |
Source: Fingal County Council Traveller Accommodation Programme 2014 – 2018
Disability Housing
Fingal County Council is committed to implementing the framework for the delivery of housing for persons with disabilities set out under the ‘National Housing Strategy for People with Disability 2011-16’. In the Strategy the term “disability” is used to refer to persons in one or more of the following categories of disability: sensory disability, mental health disability, physical disability and intellectual disability.
Fingal County Council is currently developing a Housing Strategy for People with Disabilities. It is intended that this strategy will form an integral part of the Housing Services Plans and will promote and support the delivery of accommodation for people with disabilities using all appropriate housing supply mechanisms. This strategy will also support longer term strategic planning.
No. of individuals with a Disability on the Fingal Housing List (November 2015)
|
Physical |
Intellectual |
Mental Health |
Sensory |
|
|---|---|---|---|---|
|
FCC Housing List |
95 |
14 |
15 |
2 |
|
Physical |
Intellectual |
Mental Health |
Sensory |
|
|---|---|---|---|---|
|
Congregated Settings |
16 |
288 |
0 |
0 |
A large number of the people with intellectual disability also have mental health issues
There are a number of grants also available to assist those living in Fingal with a disability including the Housing Adaption Grant.
Current grants awarded 2015 and projections for 2016 -2019
|
Housing Adaptation Grants |
2015 |
2016 |
2017 |
2018 |
2019 |
|---|---|---|---|---|---|
|
Small Works |
89 |
92 |
94 |
96 |
98 |
|
Major Works |
62 |
64 |
66 |
68 |
70 |
|
Mobility Aids Grants |
50 |
52 |
54 |
56 |
58 |
|
Total |
201 |
208 |
214 |
220 |
226 |
Source: FCC Disability Housing Needs Statistics
Housing the Elderly in Fingal
The elderly accounts for approximately 11% of housing need in Fingal as per Census 2011. Estimates by the CSO indicate that the number of older people will almost double in all regions of Ireland from 2006 -2026. The Council has circa 700 tenancies registered to tenants with this age profile.
Housing Needs Assessment 2013 – Fingal Elderly Age profile
|
50 but less than 60: |
469 |
|---|---|
|
60 but less than 70: |
160 |
|
70 and over: |
40 |
|
TOTAL |
669 |
Source: Fingal Age Friendly Housing Sub Committee 2015
The FINGAL Age Friendly Strategy 2014-2019
On the 29th of September 2011 Fingal Development Board and Fingal County Council jointly signed the Dublin Declaration on Age Friendly Cities and Communities, a World Health Organisation Initiative. Both have engaged in the process of development of the Fingal Age Friendly County Initiative to achieve the following actions:
- Engage with Agencies in Fingal representing and working with older people
- Form a Fingal Age Friendly Alliance
- Engage with Service Providers
- Establish a baseline of services and policies concerning older people
- Engage with older people regarding their needs and their inputs to the strategy by conducting a survey and consultation.
- Conduct a SWOT analysis to identify Strengths Weaknesses Opportunities and Threats
- Draft a Strategy and submit to the Fingal Age Friendly Alliance for agreement
- Launch the Fingal Age Friendly County Strategy
- Implement the Age Friendly Strategy 2014 – 2019
- An Interagency Housing Sub-Committee has recently been established under the aegis of the Age Friendly Alliance
There are also a number of grants available to help the Elderly including the Housing Aid for Older People grant.
Empty Nesters Scheme
Fingal County Council operates a ‘Financial Contribution Scheme’ whereby persons of senior citizen age who own their own dwelling in the County area and who find their dwellings too large for their needs, may request the Council to purchase their dwelling and be allowed to rent a Council senior citizen dwelling, subject to the payment of a financial contribution which is set at 1/3 of the net proceeds of the sale price. This scheme is considered by the Council to be an important method of sourcing family type houses for letting while at the same time making a positive impact on reducing the significant number of under-occupied dwellings in the County.
Contents
Materials
References
Observations
Observations
Fingal housing plan. There is a significant lack of housing in the Fingal area coupled with a huge demand for suitable affordable housing for families